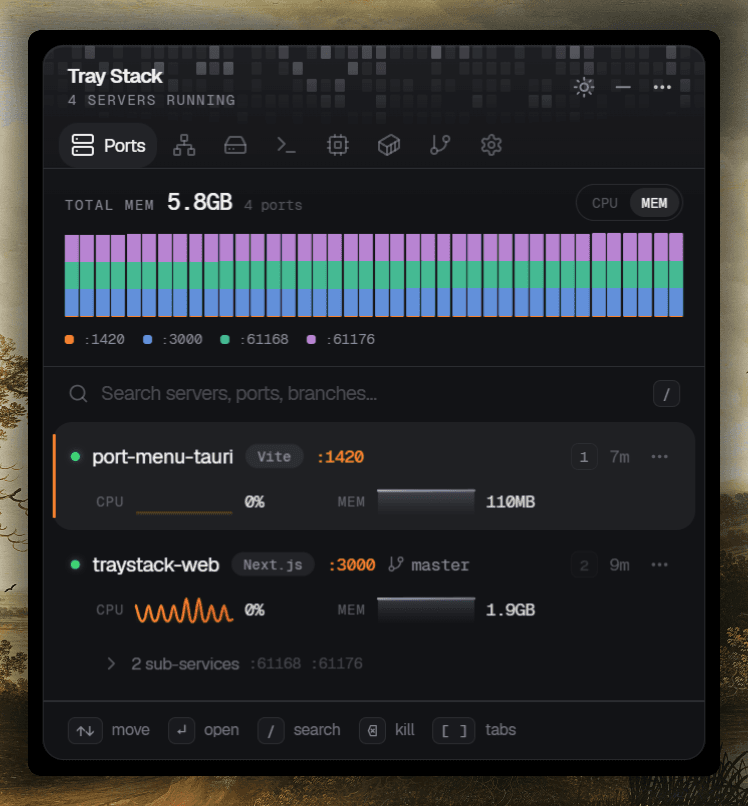
PortsLive dev server detection
Every server running on your machine — project, branch, port, uptime — with live CPU and MEM sparklines. Open, copy, or kill straight from the row.
Tray Stack auto-detects every local server running on your machine — knows the project, branch, port, and uptime — and lets you open, copy, or kill any of them without breaking focus.
Every 5 seconds, scans listening TCP ports and matches them by three signals: ~60 known dev runtimes (node, Vite, Cargo, Python, Hugo…), a process whose cwd lives inside a Git repo, or any of ~25 conventional dev ports.
Reads .git/HEAD directly — no libgit2, no shelling out — so the menu shows your repo name and current branch (or short commit when detached). Worktrees and submodules just work.
Skips privileged ports (<1024) and a curated list of OS/service processes — svchost, lsass, dwm, RuntimeBroker, SearchIndexer — so only your dev work shows up. IPv4 + IPv6 dupes are collapsed.
One row tells you everything you need to know about a running server — what it is, where it is, how it's doing — without leaving the tray.
Status dot
Green while the process is alive and listening.
Project
Repo name from .git/HEAD, or the working-dir name as fallback.
Runtime
The dev tool the scanner matched — Vite, Next.js, Cargo, Django, and friends.
Port + branch
Localhost port and current Git branch (or short commit when detached).
Quick-jump
Press the number to open the row. Sequence resets on each scan.
CPU + MEM
Per-row sparkline and gauge — sampled while the popover is hidden, too.
The same tray icon opens onto Network, Storage, and your Dev Environment. Tab through with [ and ] — same shortcuts, same chrome, all your dev metrics in one card.
Every server running on your machine — project, branch, port, uptime — with live CPU and MEM sparklines. Open, copy, or kill straight from the row.
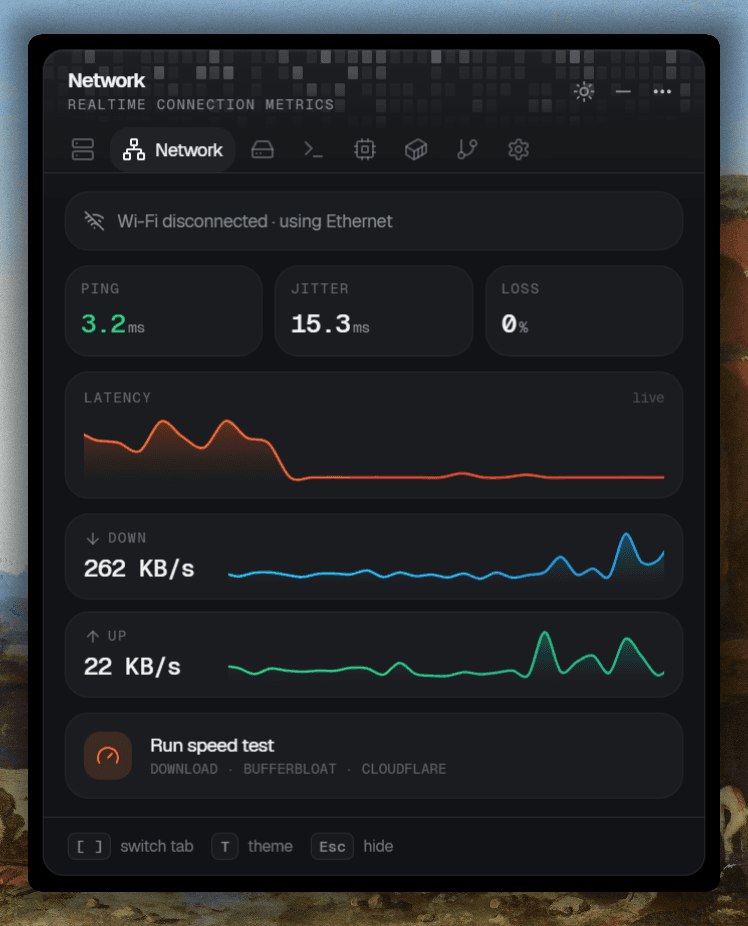
Ping, jitter, packet loss, latency, down/up throughput — all live, all in one card. Trigger a Cloudflare bufferbloat speed test without leaving the tray.
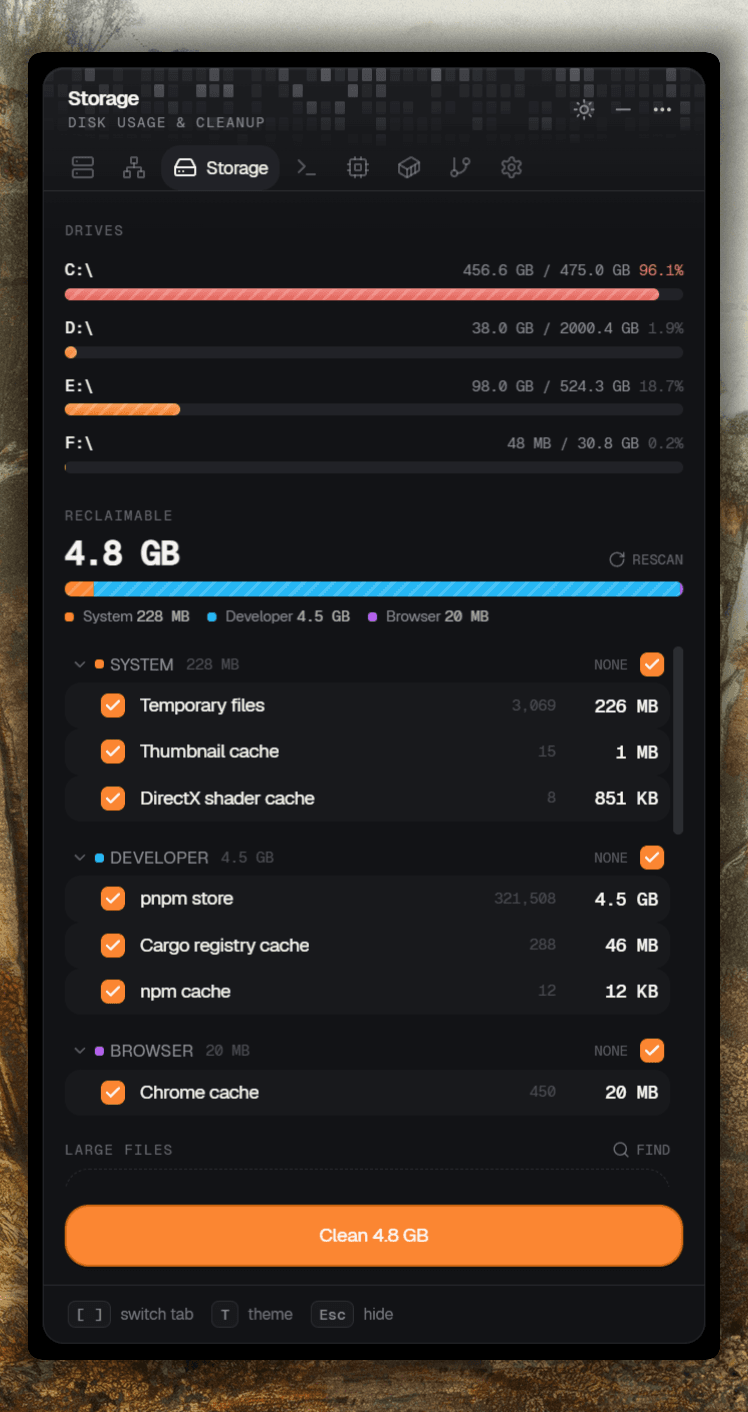
See every drive at a glance, then reclaim gigabytes from temp files, pnpm/npm/cargo stores, and browser caches — categorised, opt-in, one big button.
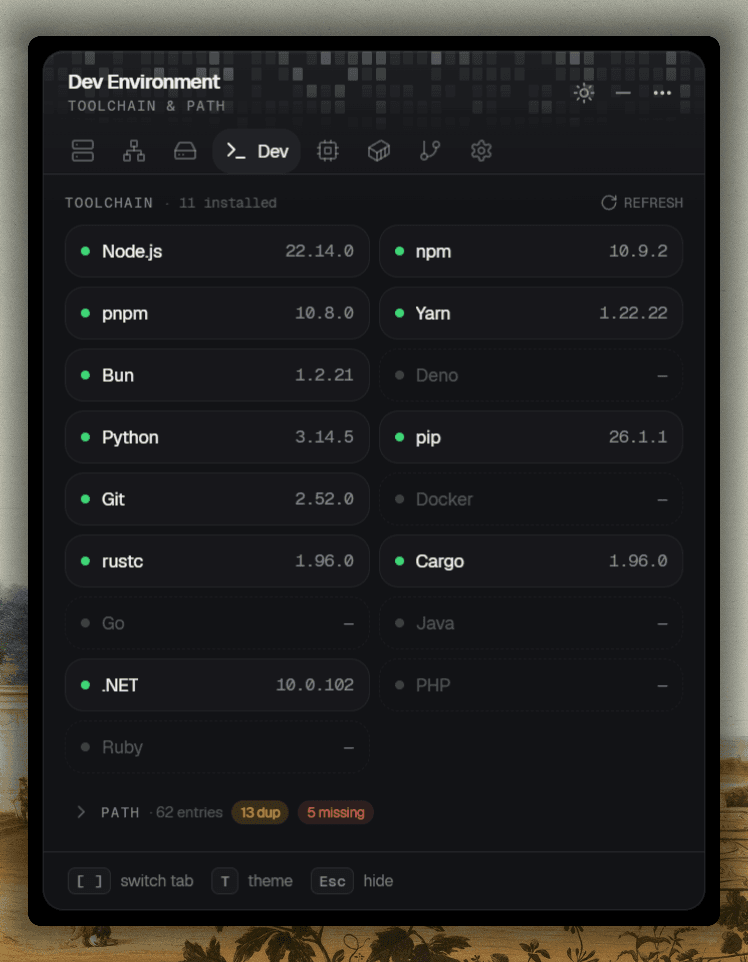
Versions for Node, Bun, Python, Git, Rust, .NET — at a glance, with PATH duplicates and missing entries flagged before they bite.
No daemons, no indexes, no git on your PATH. Tray Stack reads .git/HEAD directly — so the menu names projects the way you do, in every corner case Git can throw at you.
.git/HEAD, read directly
No libgit2, no shelling out to git. A handful of syscalls reads the branch ref — or the short commit hash when you're on a detached HEAD.
Worktrees + submodules
Resolves .git-file gitdir: pointers, so a server running inside a worktree, submodule, or sparse checkout still shows the right repo name and branch.
Walks the tree
Crawls up from each process's working directory until it hits the repo root. Falls back gracefully to the working-dir name (or the process image) when there's no repo.
Detached HEAD
Bisecting, on a tag, or mid-rebase? The menu shows a short commit hash instead of an empty branch — so you always know exactly what's running.
Both binaries share the same scanner — they only differ in how they paint the menu. Use the small one if you live in your OS's native UI; use the popover if you like sparklines and keyboard shortcuts.
port-menu·~550 KB
An idiomatic OS tray menu — header with a live server count, one item per service, with Open / Copy URL / Kill nested in a submenu. Per-port Open/Copy for each extra port. Looks and feels like every other menu-bar app on your machine.
port-menu-ui·~3.3 MB
A frameless, always-on-top card that floats next to the tray. Live CPU & MEM sparklines per server, a separate usage-history page, dark/light themes, toast confirmations, full keyboard navigation.
The popover samples per-process CPU and memory in the background, even while hidden, so the moment you open it you see what each server has been up to.
Aggregate view at the top of the popover — total memory in use plus per-port history, so you can see at a glance which port is hogging RAM.
Each server row carries its own CPU sparkline and a MEM gauge. The popover keeps a rolling ~48 samples per process — accruing even while it's hidden.
Press H for a dedicated page with larger CPU and MEM charts per service, plus current and peak readouts at a glance.
Background sampler runs continuously so history accrues even when the popover isn't open. Multi-port services collapse into one row, kill once stops them all.
Click the tray, hit a key, get back to your editor. The popover navigates with arrows or vim keys, opens with Enter, and dismisses on focus loss.
Every binary doubles as a CLI. Pass --scan (or -l) to print every detected server — including nested extra ports — and exit. Perfect for pre-commit hooks, status-bar integrations, or one-off sanity checks.
$ port-menu --scan

3 dev servers running:

  :3000  acme-storefront      main             up 1h 12m  http://localhost:3000
         vite (pid 4821)
  :8000  ml-dashboard         main             up 4m      http://localhost:8000
         python (pid 2207)
  :5173  api-gateway          feat/webhooks    up 22m     http://localhost:5173
         node (pid 9134)
↳ :49316 http://localhost:49316No Electron, no webview, no background JS runtime. Just a single Rust binary that draws into the OS tray, depends only on standard system libraries, and can be set up to run at login with a Startup-folder shortcut. Release profile is size-optimized, LTO'd, and stripped.
Tray menu binary
~550 KB
no webview
Popover binary
~3.3 MB
egui + glow
Written in
Rust
single native exe
Runs on
Win · macOS · Linux
tao + tray-icon
One install, every project you start.
A one-time $29 purchase — no subscription, free updates.